FAQs
The following are some of the most frequently asked questions and steps needed to perform various functions .
Q: How can get computational backup for values shown in result window?
Each results shown on the Result Display Window is fully supported for its computations.
To display these details just tap at the amount (or its caption).
Q: How can I compare two scenarios?
Build the initial scenario with applicable data.
Select Options followed by Compare. Choose the comparison option. Each input made after this is analyzed and its cumulative impact is shown at the bottom of result display window in
Red or
Green color reflecting overall negative or positive impact.
If the alternate scenario is a modification of current scenario
Make data additions or modifications as needed. PlanMode will compute and compare the results with the previous scenario.
If the alternate scenario is going to be built from scratch
Options then Plan then New Case
Build the new scenario. PlanMode will compute and compare the results with the previous scenario.
If the alternate scenario is already saved in a file
Tap Options then File then Open Existing Case
Select the file of the case you want to compare. Upon loading PlanMode will show the details and the bottom-line difference.
Q: There is only one default input available for
income growth for future years. How can I vary the growth of a specific
item from one year to the next?
You can make such input in the Expanded Input section
where you can control the amount enter for each year, or, for
more flexibility, use an Expression Input to make this entry.
Expression Inputs can be made in the main input section by a
long-click on the input box. The format of input to enter a
75,000 income growing by 8% in the second year, 7% in the third
and later years will be-
=75000,%8,%7
Note that Expression Input is a premium item available when
premium features are active in your app.
Q: I am using a 7 inch tablet and can see 3 years of
cash flow statement on the screen. The screen is wide enough to
display additional years. Can I increase number of years shown?
An option on the customization panel lets you toggle
between 3 or 5 years displayed on the screen. In either case you
can scroll back and forth from year to year by navigation keys
at the bottom.
Q: Is the data shared with an external server for computations & report generation?
No. PlanMode is fully self-contained app. All computations and scenario generation takes place within your device. No data is transmitted or shared.
Q: Can you give an example of how to use PlanMode for a quick singular use for comparing alternatives, such as lease vs purchase of a car?
Let’s assume the following options are available-
Lease it for $500 per month for 84 months with $1,000 upfront payment or purchase it for $40,000 in total. If purchased we assume that the asset will depreciate about 18% per year.
For the sake of this example we assume you are Single and have $100,000 annual income in total and get 4% return on your savings where you have $75,000 currently available. The purchase will be made from these savings.
Enter the profile data first. Then enter the first choice and activate Compare (static) feature. Now zero out the first choice and enter the second choice. At this point a red or green display line will represent the cumulative difference of the second choice versus the first over the life of the lease-
Here are the entries from scratch if your profile data does not exist-
Options, Settings, Planning Span, ENTER 7 -----indicates 7 year planning span
Customize Results, Result Display, 2nd column, ENTER 7 ------to show 7th year in the result window (optional)
Data, Projection Defaults, Bank Interest Rate, ENTER 4 ------indicates 4% interest on savings
Additional Items, Purchased Assets, ENTER -18 ------indicates 18% annual depreciation
Data, Cash Accounts tab, Savings Account box, ENTER 75000 ------Savings account balance
Data, Income tab, Wage, Salary box, ENTER 100000 ------annual income
Advanced, Non Recurring Data, Expense, Major Purchase, 1st Purchase Year, ENTER 2014 ------purchase year – option 1
Purchase Amount 1, ENTER 40000 ------purchase amount if purchased – option 1
Advanced, Customize Results, Plan Title, ENTER Purchase Option ------optional title for this computation
To Compare
Data, Options, Compare, Static Compare Mode ------activates the compare mode & shows 2 columns of values in the 7th year
Advanced, Non Recurring Data, Expenses, Major Purchase, Purchase Amount 1, ENTER 0 ------Removes the purchase - the 1st option
If the lease payments are ordinary expense, enter as follows
Data, Expenses, Other Expenses, ENTER 6000 ------Annual lease payments (500x12) as expense
Advanced, Customize Results, Plan Title, ENTER Personal Lease ------optional title Otherwise, enter
Data, Expenses, Business Exp, ENTER 6000 ------Annual lease payments (500x12) as deductible expense
Advanced, Customize Results, Plan Title, ENTER Business Lease ------optional title
The result window should display cumulative financial comparison at the end of the 7th year under each choice. At the bottom of this screen a red or green value is displayed to highlight the difference.
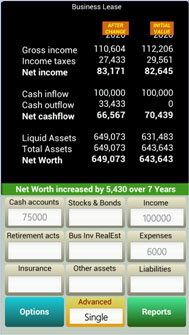
Note - The results you get will largely depend on the details and accuracy in depicting your default financial profile. The closer your profile is to reality the better the quality of the results are.